“As a data trend nerd, I love helping collectors avoid the same rookie mistakes I made and buy rare coins with the best potential for future price gains.”
Dan, The Rare Coin Man / RareCoins101.com
Discover Rare Coins Destined for Greatness
Welcome to Rare Coins 101. I'm Dan, the Rare Coin Man. Kinda catchy, huh?
No one buys coins with the expectation of watching them decline in value over time. To the contrary, most of us hope to see our collections someday command prices far above what we paid for them. After making a purchase, we want our coins to soar like an eagle in the price guides. Sadly, what usually happens looks more like a bug stuck in flypaper.
If your objective is to acquire rare coins destined for greatness, you’ve landed in the right spot. No need to get trapped in flypaper ever again!
As a data nerd, I’ve been researching value trend numbers for 40 years and can now share this this Rare Coins 101 Axiom about coin collecting:
Key date rare coins that have historically been the most eagerly pursued by the collector base are the best bets for strong value appreciation in the years ahead.
In reality, only a small subset of collectible coins attains this lofty status. Okay, which coins make the cut? Thankfully, there's a more scientific approach to answering that question than throwing darts blindfolded!

All you have to do is compare long term price movements across a wide spectrum of coin types for individual dates and identify the coins having the best track records. Simple concept to grasp, but not easy to do unless you have researched many decades of coin value fluctuations. Who has time to do that? So, back to the dartboard? Nope! Dan, the Rare Coin Man to the rescue!

Analysis & Key Date Recommendations
My site, Rare Coins 101, has already done the tedious analysis and provides you with data-based bottom-line Key Date List of Recommendations for selecting stellar rare coins with bright futures.
(You won't hurt my feelings if you abandon my home page right now and skip on over to the key date recommendations -- after all, that's the "meat and potatoes" of this site. Soooo.... here's that link again to the Key Date Coin List.)
From now on, don’t add any more duds to your collection. Using information tables and charts, I’ll highlight blue chip coins that stand the best chance of becoming valuable heirlooms someday for you and your family.
Wish I Knew Then What I Know Now...
Let me illustrate the advantage of data-driven decision making by recounting a regretful episode that began early in my adult coin collecting career. No one enjoys confessing to be a dummy, but here goes ...
In April 1985, I received a phone call from a coin telemarketer. That was back in the heyday of the telemarketing craze. Many of them were deceitful swindlers who didn’t care if they were hurting honest people, but thankfully they met the same fate as the extinct Dodo Bird before fully undermining the bedrock enthusiasm for coin collecting.
I ended up buying ten 1943 Walking Liberty half dollars in MS-65 Uncirculated grade*. The Walkers were one of my favorite coin types, so it didn’t take much arm twisting for them to get the order. Cost was $115 each (the fair market retail value at that time) for a total of $1150.
Although the 1943 was one of the most common dates of the Walker series, my inexperience led me to believe they’d rise strongly in value over time, due to their status as a collectible coin AND they were beautifully uncirculated. Brother, was I wrong! In 2024, the exact same 1943 Walker in MS-65 retails for about $125.(1) Less than a 10% gain over a period of almost 40 years! You might say I made a bad decision.
* They were touted as MS-65 coins, but years later I realized they were improperly cleaned, overgraded and hence, overpriced. I was too trusting and took what they had to say at face value. This was before third-party grading services and slabbing became commonplace in coin collecting. PCGS and NGC did not start up until 1986 and 1987, respectfully.
Had Rare Coins 101 existed back in 1985, I could have avoided that mistake by learning the 1921-D is a key date with one of the best price performance records of the entire Walker series, due to collectors fiercely competing for a very limited supply.
For the same $1150,(2) I could have purchased a 1921-D Walker in EF-45 grade, a coin today, in 2024, retailing for approximately $4625.(3)
Admittedly, this is NOT an S&P 500 type return, but we’re talking about a rare coin purchase, not your 401k retirement fund. Still, a much better financial benefit for the same money, with the dual satisfaction of proudly owning a prized numismatic** rarity of high esteem.
Dang, wish I knew then what I know now!

**Chances are you already know the meaning of the word numismatics. In case you don't, it's a term describing the study and collection of money, including coins, tokens, paper currency, and sometimes medals. Use that word to impress your friends and others... It helped me get a good job back in 1993!

As you study the Key Date Coin List on this site, we do have to add this disclaimer: Just because a particular coin has performed relatively well in the past, there is no absolute guarantee of similar future results. BUT, as the data shows, coins that have consistently risen in value over long periods of time in the past are the best bets for appreciation in the years ahead.
Enhance Your Numismatic Experience
There is more to Rare Coins 101 than just a list of recommendations. To enhance your numismatic experience, we also offer:
- Getting started in coin collecting.
- Analysis of what makes a coin valuable.
- A monthly Index for estimating the current direction and strength of the U.S. rare coin market.
- Coin grading basics.
- Best places to buy coins.
- Thoughts on coin investing. Is it a good idea?
- Beautiful coin photos and historical legacies.
- Listing of the Top 15 most valuable United States coins.
- Printable reports in PDF format.
If you’ve read this far, odds are you’re the type of collector with a visionary approach to buying rare coins. You know it’s better to save up and buy one documented numismatic rarity of great promise rather than a dozen coins of lesser potential. You should feel right at home here.
Before you get started with the Rare Coins 101 lessons, don't forget to check out the section directly below. It explains some of funny stuff you will encounter on this site.
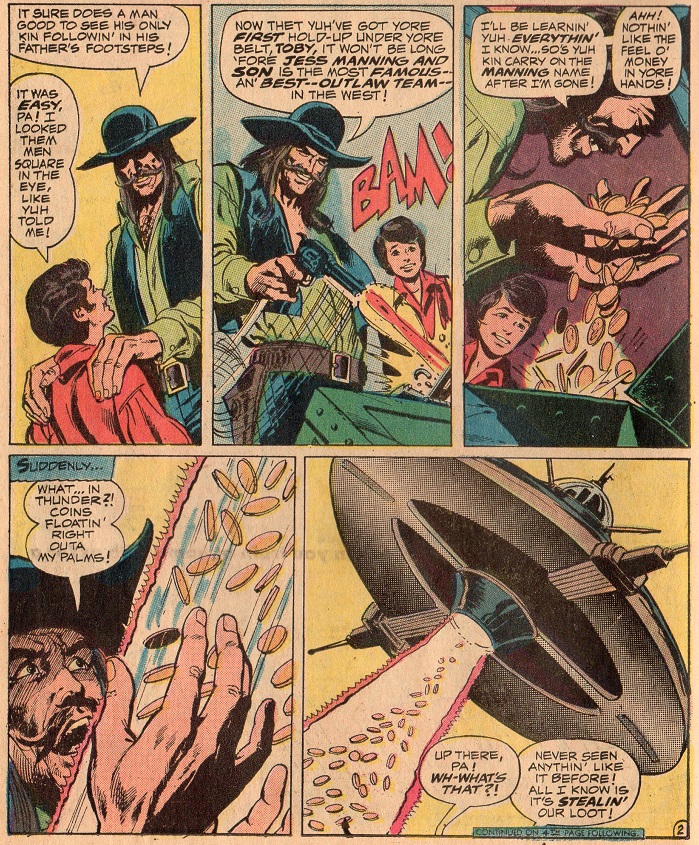
"Coins Floatin' Right Outa My Palms!"
Webmaster Dan Goevert speaking here again… I did my best to create Rare Coins 101 as a serious educational site with the ultimate goal of helping collectors identify coins destined for greatness in the years ahead.
I also like to mix in fun and nostalgia with business. Laughter causes the body to release endorphins, that in turn improves cognitive abilities and alertness, while making it easier to learn.(4)
That’s why readers will occasionally notice strangely "out of place" ideas and images on this site that apparently have nothing to do with numismatics, but through an overactive imagination and odd sense of humor, I've managed to weirdly connect them back to coins. Hopefully it'll induce a chuckle or a bit of reminiscing and make this site a more enjoyable place to spend time.
Right here is an example of the zany stuff you'll find on this site. See what I mean?
Sources
1. Gibbs, William T., Managing Editor. Coin World Domestic Values. Sidney, OH. Amos Media Company. 2024.
2. Goevert, Daniel J. Value Trends of United States Coins. Wichita, KS. Heritage Coin Books, 1987.
3. Gibbs, Coin World Domestic Values.
4. Mayo Clinic Staff. Stress Relief from Laughter? It's no Joke. 2019.
5. PCGS Coin Facts. The $4 Stella.